How design thinking can help us respond to natural disasters
Snapshot
Client The Philippine Department of the Interior and Local Government (DILG)
Problem Statement The DILG helps local government agencies get prepared, and manage natural disasters in the Philippines. We examined how it might be possible to get more reliable planning information data to and from these agencies.
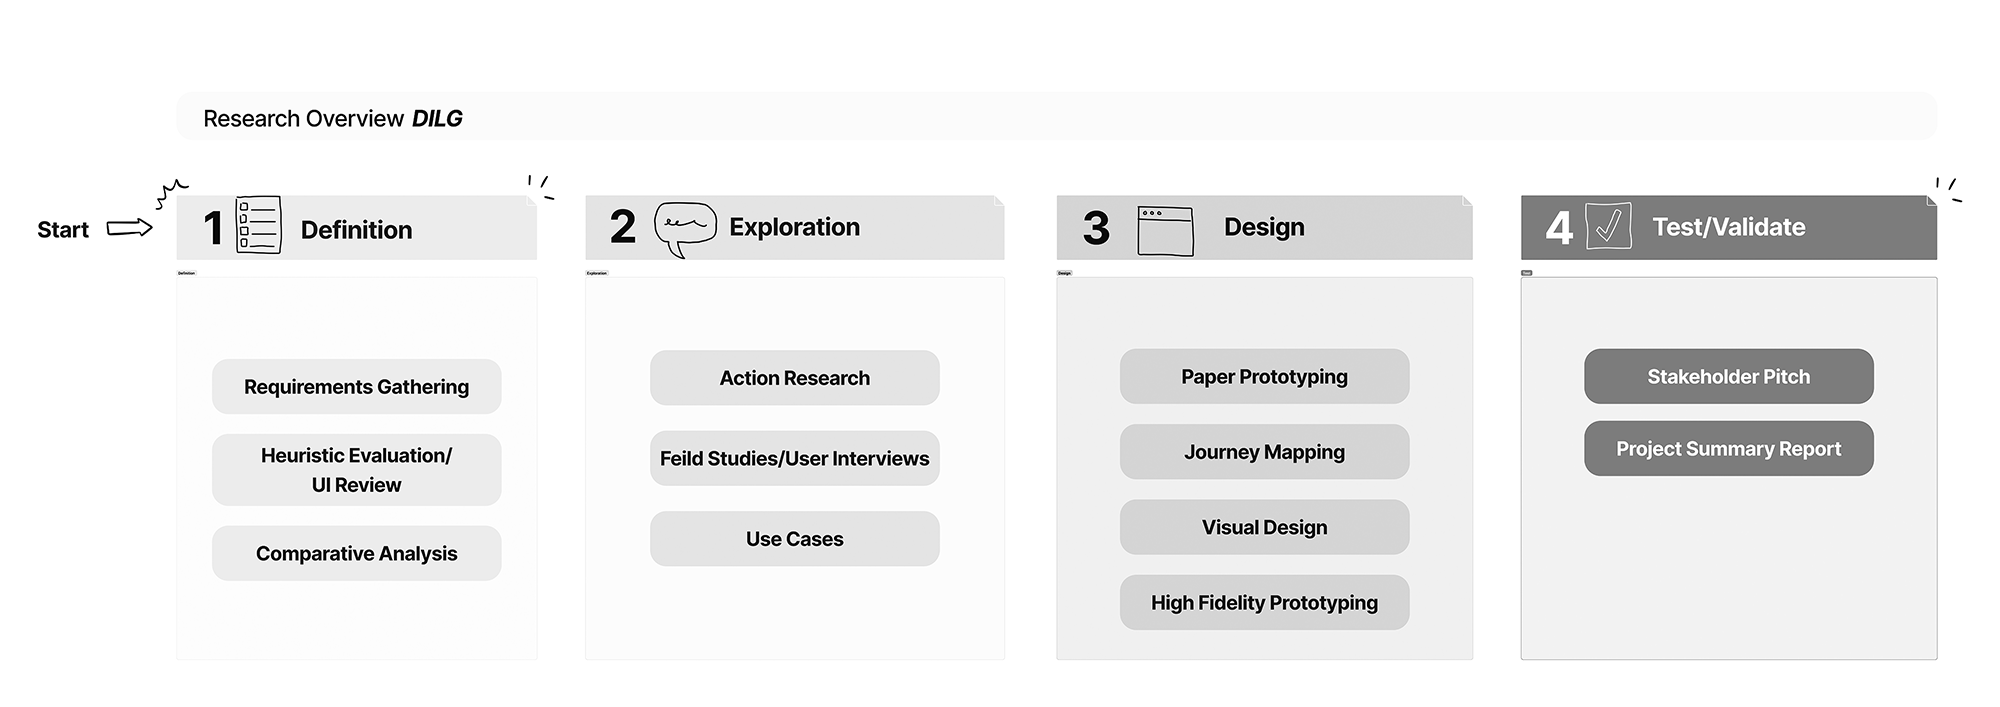
To move our projects along, we used the below research methods to generate insights about the users, their behavior, motivations, and needs.
Research Methods
Outcomes While the project pivoted away from its original plan, the team's willingness to embrace new technology and approaches allowed them to make significant strides toward real solutions. By recognising the value of cloud tools and online data, the team was able to generate valuable insights and promote these tools to others. Ultimately, the team's agility and adaptability were key factors in their success.
Detailed Process
Starting a new project can be difficult at times, as the requirements are not always fully understood or implemented. To mitigate this, we explored and documented the project's exact requirements from start to finish. I sat down with the team to understand their needs and the local context. The team had a lot to tackle, so I suggested using methods from start-up culture, such as focusing on the people being served, using existing tools whenever possible, and developing fast prototypes. Rather than providing direct solutions, my goal was to skillshare with the team, as they had a better understanding of the local context. Together we were about to scope out the project.
Requirements Gathering
For our project, we wanted to figure out which digital tools we needed to build ourselves (which can be time-consuming and expensive) and which parts we could use pre-existing software for. To do this, we decided to start using these tools ourselves.
Our team wanted to create cloud-based software and information sharing. To get a feel for how these systems work, we decided to use off-the-shelf cloud-based software for all our work. This included Google Drive, Google Docs, Trello, Slack, and Canva. The team quickly adapted to everything working out the pro’s and cons of each tool.
Action Research
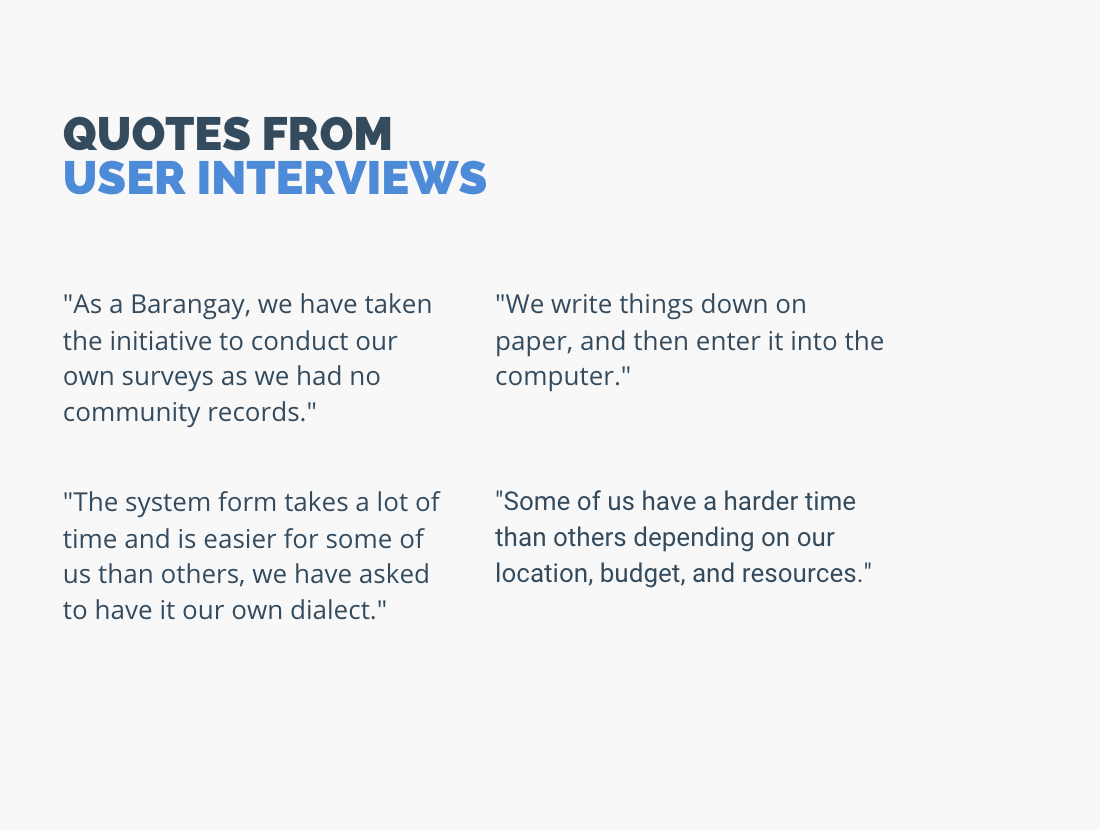
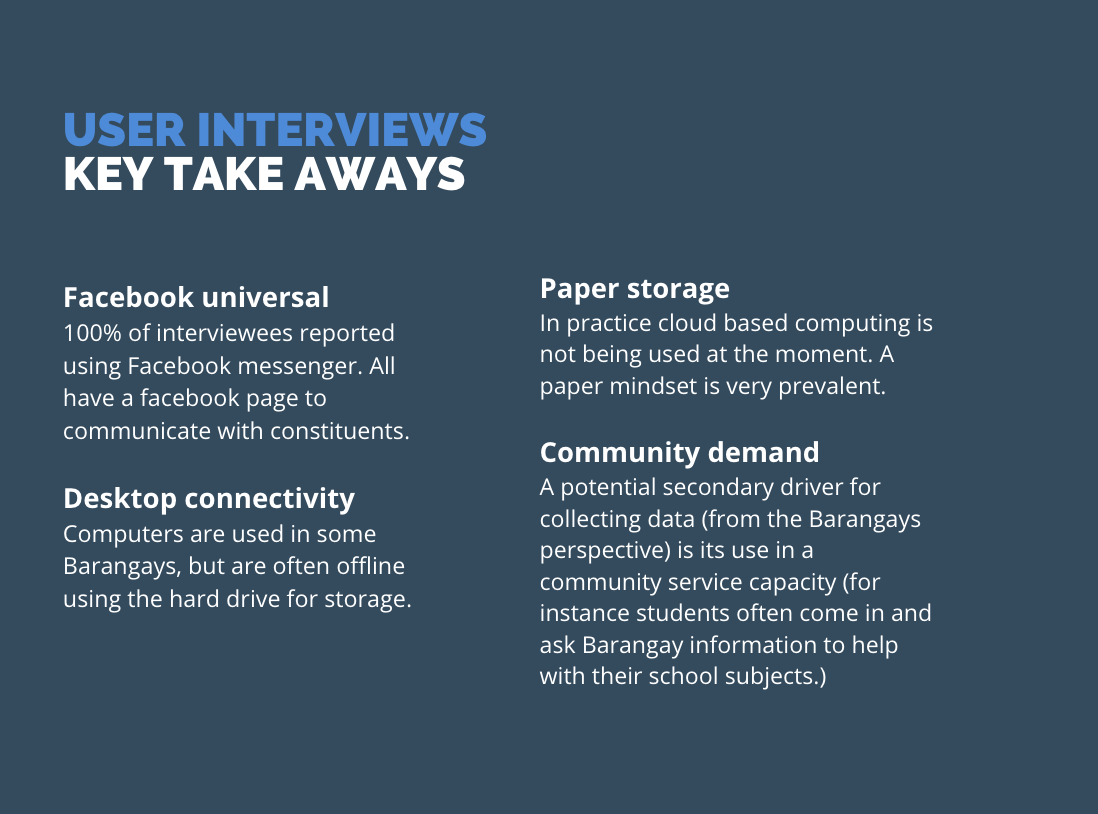
Gaining knowledge through conversations with your users can be invaluable. To learn about Disaster Risk Management (DRM) in the Philippines, we visited the Bargangays (districts), held workshops, and conducted structured interviews.
Field Studies/Structured interviews
It's important to pay attention to the details. I looked at the current disaster response system, and analysed its best and worst features.
Heuristic Evaluation/UI analysis and review
By comparing different disaster response systems and analysing their best and worst features, we were able to ascertain what was already available.
Comparative analysis
An easy and straightforward process that can quickly reveal user touchpoints, problems and needs.
Based on our interviews we developed use cases in which we outlined specific situations in which a disaster risk tools could potentially be used. We also mapped out the different touch points.
Use Cases and Journey Mapping
Sometimes, using a pen and paper is the best way to work. We used paper prototyping in our workshops, where we drew our ideas on paper instead of using computer tools. It was fun and quick, and we didn't need a lot of resources or equipment. Our process helped us talk about why people cared about the project and we learned important things about how people will use it.
Paper Prototyping
Printed out wireframe templates were useful for short fast prototypes.
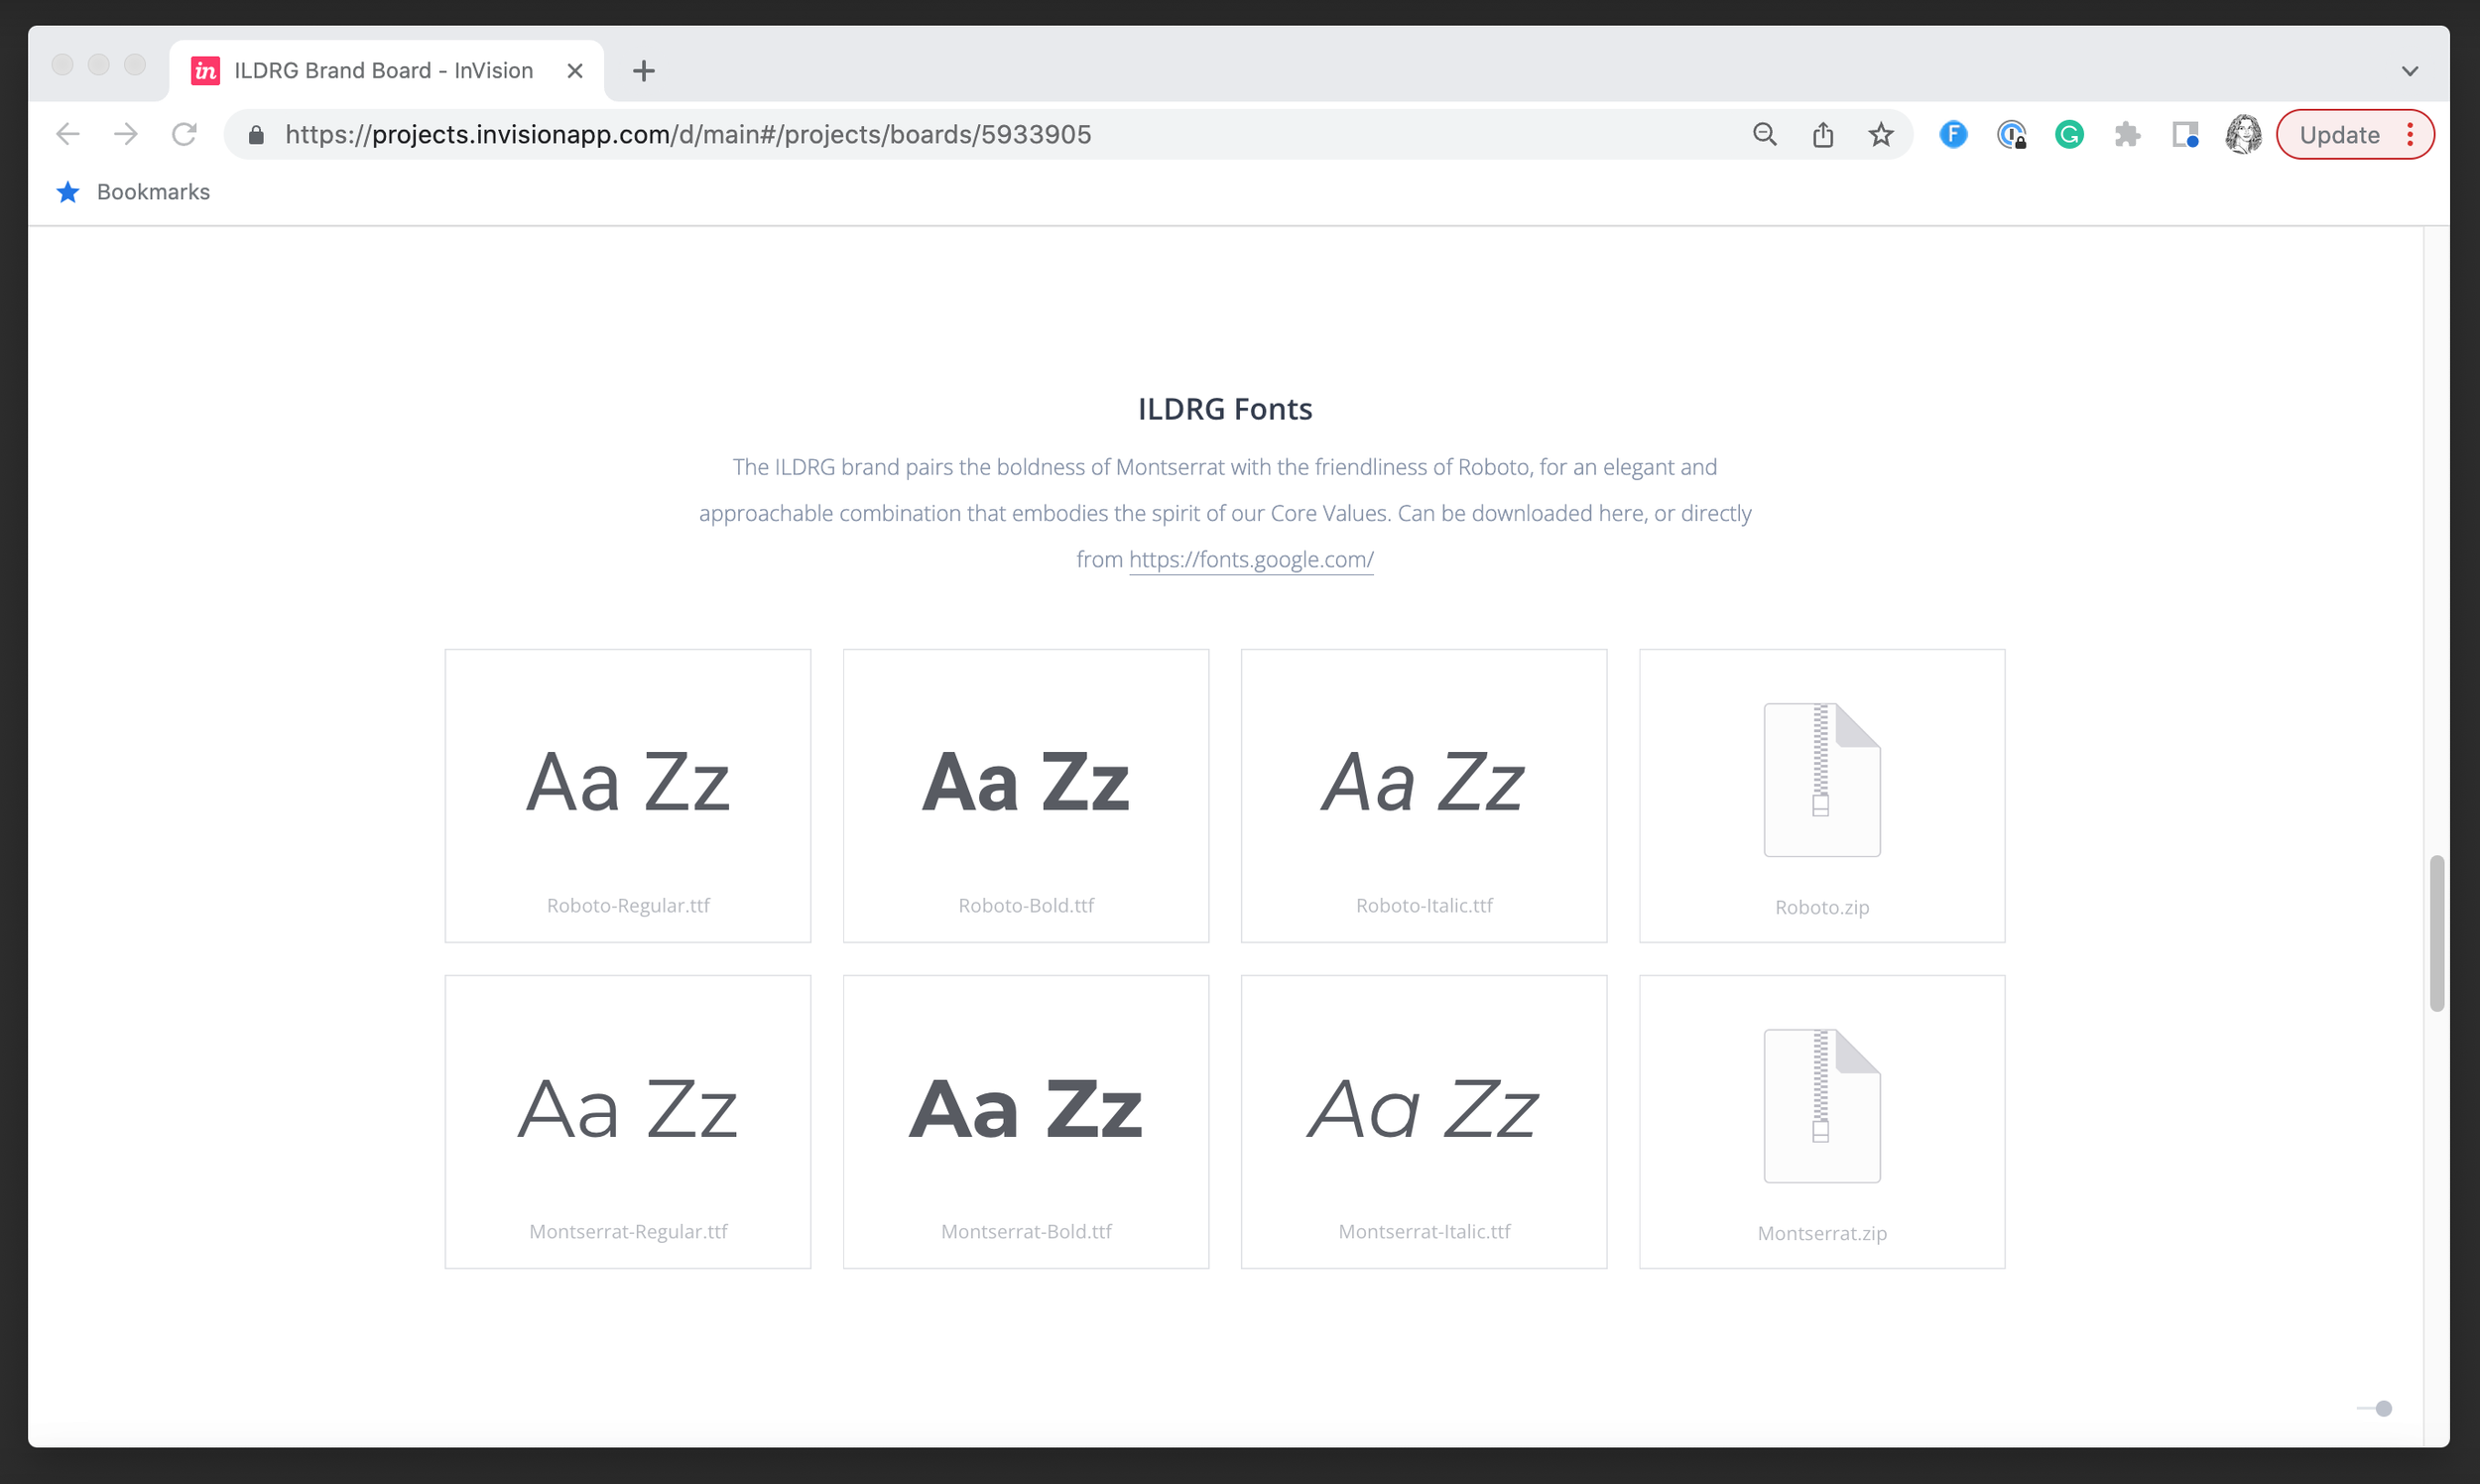
Digital design, typography, and a clear visual hierarchy make a product much easier to use. Using cloud-based software again (InVision/Canva) we created a style guide that included colours, fonts. These were used for project branding, pitch deck materials and templates.
Visual Design
We used SAAS/cloud software for both practical reasons, but also as a form of ‘Action Research’
Bridging the gap between ideas and products
High-fidelity prototyping helps to minimize the actual building of things – which in turn reduces both the labour required during the process and the materials. It also allows stakeholders to see the possibilities of a product prior to the grant approval process. We created several detailed high fidelity prototypes and brought them to meetings with project partners.
Hi-Fidelity Prototyping
Conclusion
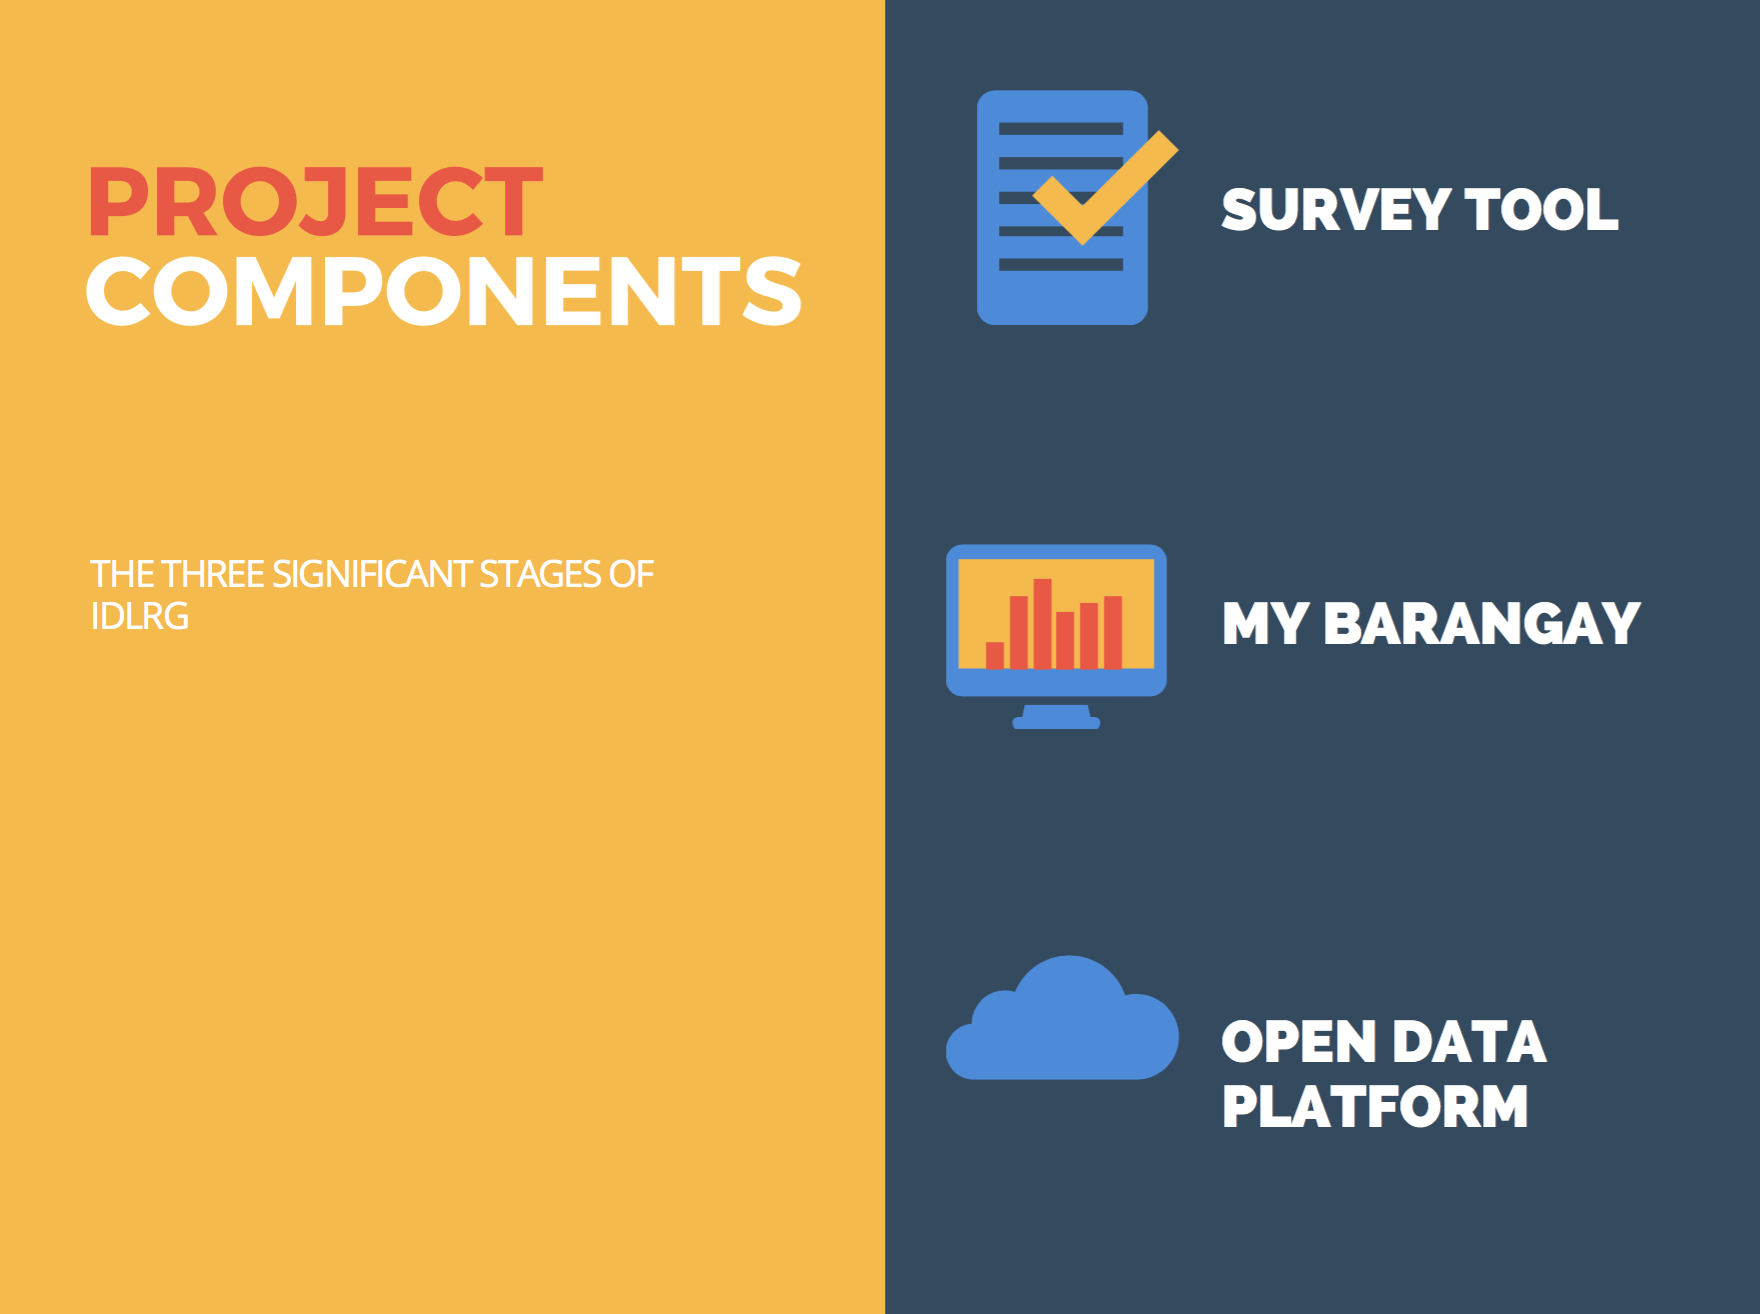
Our team developed and presented My Barangay and iDLRG as new interfaces for the information system. We redesigned the system to find more useful and accurate material, and conducted extensive research to understand population needs. We pitched refined prototypes to stakeholders for investment. We also implemented cloud software to increase efficiency, generate data, and improve disaster risk management. Passive data, such as website logs and GPS data, can help track and understand the impact of disasters. De-identified information collected from Filipinos using cloud tools can be used to inform future disaster risk management strategies and identify potential vulnerabilities for proactive measures.
The team made powerful steps towards real solutions. By adopting an agile culture, a design thinking mindset, and throwing themselves into using off-the-shelf cloud tools, they began generating data. Our team not only used these tools, but started promoting them. The Philippines is now one of the top users of Canva worldwide and i’m not surprised as the team took to it instantly.
Being online generates real-time data that can improve how we respond to real-world crises. No one thought for instance when everyone started using facebook, that one day the mobility insights would help us manage an unprecedented global pandemic. Then covid and contract tracing happened, and the facebook mobility data was jumped on by Governments worldwide. Every citizen on the cloud provides invaluable disaster risk information today and going into the future. Through our research we were able to discover that we didn’t need to reinvent the wheel each time, we just had to get into the playing field.


